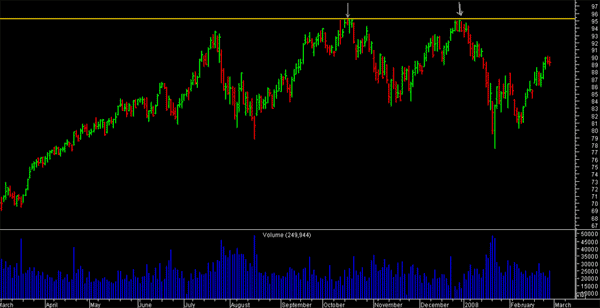
Double Top
A double top occurs when prices form two distinct peaks on a chart. A double top is only complete, however, when prices decline below the lowest low - the "valley floor" - of the pattern. The double top is a reversal pattern of an upward trend in a stock's price. The double top marks an uptrend in the process of becoming a downtrend.
Sometimes called an "M" formation because of the pattern it creates on the chart, the double top is one of the most frequently seen and common of the patterns. Because they seem to be so easy to identify, the double top should be approached with caution by the investor.
According to Schabacker, the double top is a "much misunderstood formation." Many investors assume that, because the double top is such a common pattern, it is consistently reliable. This is not the case. Schabacker estimates that probably not more than a third of them signal reversal and that most patterns which an investor might call a double top are not in fact that formation.2 Bulkowski estimates the double top has a failure rate of 65%. If an investor waits for the breakout, however, the failure rate declines to 17%.
The double top is a pattern, therefore, that requires close study for correct identification.

What does a double top look like?
As illustrated below, a double top consists of two well-defined, sharp peaks at approximately the same price level. A double top occurs when prices are in an uptrend. Prices rise to a resistance level, retreat, return to the resistance level again before declining. The two tops should be distinct and sharp. The pattern is complete when prices decline below the lowest low in the formation. The lowest low is called the confirmation point.
Analysts vary in their specific definitions of a double top. According to some, after the first top is formed, a reaction of at least 10% should follow. That decline is measured from high to low. According to Edwards and Magee, there should be at least a 15% decline between the two tops, on diminishing activity. The second rally back to the previous high (plus or minus 3%) should be on lower volume than the first. Other analysts maintain that the decline registered between the two tops should be at least 20% and the peaks should be spaced at least a month apart.
There are a few points of agreement, however. Investors should ensure that the pattern is in fact comprised of two distinct tops and that they should appear near the same price level. Tops should have a significant amount of time between them -ranging from a few weeks to a year. Investors should not confuse a consolidation pattern with a double top. Finally, it is crucial to the completion of the reversal pattern that prices close below the confirmation point.


