Learn More about Broadening Formation
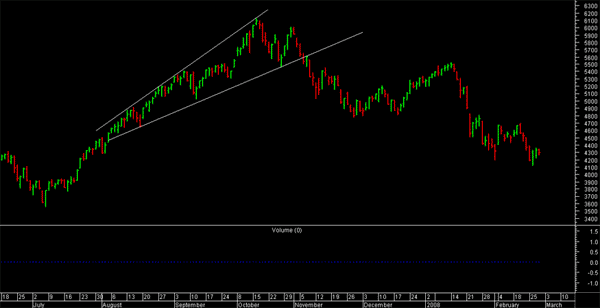
A pattern used in technical analysis to predict the likelihood of a reversal in the direction of the current trend. It is identified by finding diverging trendlines that connect a series of widening peaks and troughs. The most common type of broadening formation is found at the end of a prolonged uptrend and is used to predict a move lower.
As the two trendlines diverge from the apex, the pattern resembles a reversed version of a symmetrical triangle. This pattern is considered quite rare, but the signal it generates is deemed to be very reliable. As shown by the last candle on the chart above, many technical traders will use candle stic patterns such as a doji to confirm the reversal predicted by the broadening formation.

Broadening Top is a rally to a new high, weakness to an intermediate support level, a second rally to a higher high on increased volume and decline through the intermediate support level, a third rally to a higher high on strong volume followed by a eventual collapse Because Broadening Tops are very large reversal patterns, the technical implications are usually extreme. The measured target is derived by subtracting the height of the pattern from the eventual breakout level.
·Unlike most consolidation patterns, broadening tops feature increasing wide ranges and greater volatility as time passes. ·Volume increases as the share prices rises. Normally this is bullish but rallies prove very short-lived and declines "take-out" previous support levels. ·Broadening formations are only found in topping formations because they are the product of unrealistic expectations on the part of bullish investors. Downside breakouts often lead to small 2-3% declines followed by an immediate test of the breakout level. If the stock closes above this level (now resistance) for any reason the pattern becomes invalid.
Whereas some technical patterns are characterized by consensus and a general lack of volatility, the same cannot be said about the broadening top. These patterns always feature indecision and extreme volatility. When one looks at the pattern the resemblance to a megaphone is striking. The stock makes a series of higher highs and lower lows. Normally as time passes and more information is disseminated, investors come to consensus and volatility slows but just the opposite is true of broadening tops.
There are distinct parts of every broadening top formation. The first of three small tops (top #1) occurs after a spectacular run to new high on increasing volume. Generally, this advance will be the result of better than expected earnings, a new product and/or a barrage of Wall Street recommendations. However, as the stock surges to new highs sellers also step-up selling efforts and it is not long before the stock settles back to a prior support level (a).
After several sessions of slower trade more positive news pushes the stock to yet another new high on increased volume (top #2). The increased volume should be a sign that bullish consensus is building but once again the stock falters, falling to a relative new low (b) just days after making a new high. Although the news flow is still very positive, rumors begin to circulate that some institutions and insiders are beginning to liquidate positions.
It is at this time that there is a full scale defense of the stock by bullish investors. Wall Street firms make new recommendations with lofty price targets and once again, the stock begins to move higher. Although volume is strong, it is noticeably less than the prior rallies. The stock moves to third new high (top #3) in as many attempts. All of the news is positive. The company may be raising guidance, setting a stock split or talking about the outlook for new products. The prospects seem bright but even as the stock is making a new high, there is skepticism among some investors. Days later the stock begins to falter on increased volume but no specific news. Several days later the stock is collapsing and support at the most recent low is in jeopardy. There is news that a large shareholder has filed to sell stock, bullish investors panic. Weeks later the stock sinks back to the longer-term support level.


