Japanese Candlesticks Chart
In the 17th century, Japanese rice merchants invented the candlestick charting.
The guiding principles of the Japanese candlesticks charting are :
- The price evolution is more important than what can explain it (financial information economic, results, etc).
- All known information is reflected by the price.
- Purchasers and salesmen act according to their expectations and their emotions.
- Markets have fluctuations.
- Prices should not reflect the underlying value of firms.
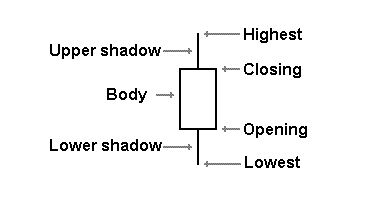
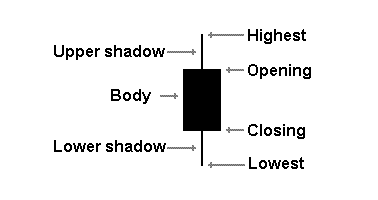
Candlestick Layout
To draw a Japanese candlestick, it is necessary to know the opening price, the closing price, low and highest. If the period is in falling, the candlestick is black. For a rise, the candlestick is white.


Basic Patterns of the Japanese Candlesticks
 |
White candlestick with small body Little price movement and represent consolidation. |
 |
Black candlestick with small body Little price movement and represent consolidation. |
 |
White candlestick with long body Intense buying pressure. |
 |
Black candlestick with long body Intense selling pressure. |
 |
White Marubozu White Marubozu White candlestick with long body. The opening price is equal to the lowest and the closing price is equal to the highest. Marked buying pressure. Sellers did not succeed to pushing price under opening price. |
 |
Black Marubozu Black candlestick with long body. The opening price is equal to the highest and the closing price is equal to the lowest. Marked selling pressure. Buyers did not succeed to pushing price on top of opening price. |
 |
White Candlesticks with a long upper shadow and short lower shadow Marked selling pressure but sellers did not succeed to pushing closing price under opening price. |
 |
Black Candlesticks with a long upper shadow and short lower shadow Bear signal. More the upper shadow is long, more the signal is strong. |
 |
White Candlesticks with a short upper shadow and long lower shadow Bull signal. More the lower shadow is long, more the signal is strong. |
 |
Black Candlesticks with a short upper shadow and long lower shadow Marked buying pressure but buyers did not succeed to pushing closing price on top of opening price. |
 |
White Spinning Top Spinning tops represent indecision. It's a potential change or interruption in trend. |
 |
Black Spinning Top Spinning tops represent indecision. It's a potential change or interruption in trend. |
 |
Hammer (White) and Hanging Man (Black) White candlestick (or black) with a long lower shadow and a (almost) null upper shadow. It's potential trend reversal. Hammers can mark bottoms or support levels. |
 |
Inverted Hammer (White) and Shooting Star (Black) White candlestick (or black) with a (almost) null lower shadow and a long upper shadow. It's potential trend reversal. Inverted Hammers can mark support levels. A Shooting Star can mark a resistance level. |
 |
Doji The doji appears when opening and closing price are (almost) equal. Neutral pattern, it often precedes an important price movement. |
 |
Long-legged Doji Long-legged doji have long shadows that are (almost) equal in length. Long-legged doji represent strong indecision. |
 |
Doji with a short upper shadow and long lower shadow Bull signal if it appears in a bear trend. |
 |
Doji with a long upper shadow and short lower shadow Bear signal if it appears in a bull trend. |
 |
Dragon fly Doji Dragon fly Doji is a potential trend reversal. Strong signal if it appears in a bear trend. |
 |
Gravestone Doji Gravestone Doji is a potential trend reversal. Strong signal if it appears in a bull trend. |


